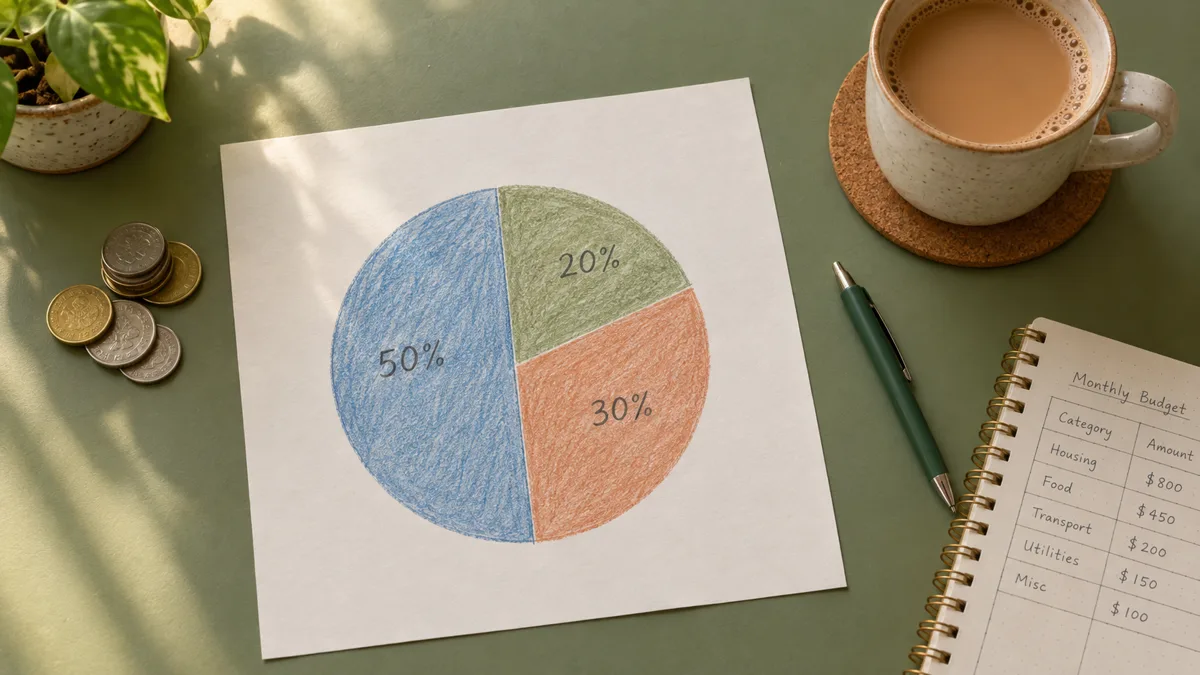
A budget fails in two ways: no plan at all, or a plan so complicated it dies by the second week. Budget percentages sit in the sweet spot between the two. You decide what share of your income goes to needs, wants and savings before the month starts, then you only have to check that reality roughly matches the split. This guide covers the classic splits, the recommended range for each spending category, and how to adjust the numbers when your life refuses to fit a template.
A budget percentage is just one category of spending divided by your take-home income, written as a share of the whole. If you bring home $3,000 a month and spend $900 on rent, your housing percentage is 30%. That is the entire maths - one division per category.
The point of thinking in percentages instead of amounts is that percentages scale and compare. $900 of rent means nothing on its own; 30% of income immediately tells you whether housing is crowding out everything else. Percentages also survive a pay rise: when income changes, the split still makes sense without rewriting the whole budget.
The best-known split is 50/30/20: about 50% of after-tax income for needs, 30% for wants, and 20% for savings and extra debt payments. It became popular because it is three numbers you can hold in your head, and it forces savings to exist as a category instead of whatever is left over.
Needs are the bills you cannot skip: housing, utilities, groceries, transport to work, insurance, minimum debt payments. Wants are everything that makes life pleasant but optional: eating out, subscriptions, hobbies, holidays, the better phone plan. Savings covers your emergency fund, retirement contributions and any extra you throw at debt beyond the minimums.
Treat 50/30/20 as a first draft, not a verdict. In an expensive city, housing alone can eat 40%, and no spreadsheet will shame that away - the split simply shows you what has to give elsewhere.
If you want more detail than three buckets, these ranges are a sensible starting point for a typical household. They are guidelines gathered from common financial-planning advice, not rules - your percentages should add to 100, not to someone else’s idea of a life.
Housing: 25-35%. Utilities: 5-10%. Groceries: 10-15%. Transport: 10-15%. Insurance and healthcare: 5-10%. Debt payments: 5-15%. Savings and investing: 10-20%. Personal and entertainment: 5-10%. Clothing and household items: 2-7%. Giving and miscellaneous: 1-5%.
Notice the ranges overlap and the midpoints add up to more than 100%. That is deliberate: you pick from each range until your total lands exactly on 100. Lower housing costs buy you roomier wants or faster savings; a high-debt season means the fun categories temporarily shrink.
60/30/10 is the realistic cousin for expensive areas: 60% needs, 30% wants, 10% savings. It keeps the structure while admitting that some seasons of life leave less room to save.
70/20/10 works for variable or commission income, where the safe move is living on 70% and splitting the rest between savings (20%) and giving or fun money (10%). Irregular earners often budget off their lowest recent month and treat better months as bonus savings.
80/20 is the minimalist version: live on 80%, save 20%, and skip category tracking entirely. It suits people who hate detailed budgets but still want the single habit that matters most - paying themselves first.
Step one: write down your real after-tax monthly income. If it varies, use the average of the last three months.
Step two: pull up last month’s bank statement and put every expense into a category. Do not fix anything yet - just find out where the money actually went. Most people discover one category (usually food delivery or subscriptions) that is wildly higher than they assumed.
Step three: compute your current percentages: each category divided by income. Compare them against the ranges above. The gap between your actual and your target is your budget, written in one line per category.
Step four: move one number at a time. Cut the worst category by a realistic amount, give that money to savings or debt, and live with it for a month before adjusting again. One change at a time sticks; a total overhaul rarely survives week three.
Say take-home pay is $3,200 a month. A 50/30/20 split gives $1,600 for needs, $960 for wants and $640 for savings and extra debt. Rent is $950, utilities $150, groceries $380, transport $180 - that is $1,660, slightly over the needs bucket. Rather than abandoning the budget, the example trims wants to $860 and moves $100 into needs: new split 52/27/21. Imperfect, but written down and sustainable, which beats perfect and abandoned.
Run the same exercise with your own numbers and you will have a personal split in under an hour. The first month is always approximate; by month three the percentages settle into something honest.
Percentages only work if you check them, and a spreadsheet makes the checking nearly free: one column per category, a row per month, and one formula per cell - category total divided by income. A tiny pie chart next to the grid turns the split into something you can see drifting before it breaks.
If you would rather skip the setup, our templates have the whole structure pre-built: income and category columns, automatic percentage calculations, a monthly comparison and the chart. Copy one into your Google account and your first percentage check takes minutes instead of an evening.
A widely used starting point is 50/30/20: 50% of after-tax income for needs, 30% for wants, 20% for savings and extra debt payments. Good percentages are the ones that add to 100 and match your real housing costs, debt load and goals - adjust the split, then check it monthly.
Divide each spending category by your after-tax monthly income and multiply by 100. A $900 rent on $3,000 income is 30%. Do it for every category using last month’s real spending, then compare against guideline ranges.
For many households, housing alone takes more than the rule assumes, so treat 50/30/20 as a first draft. If your needs run at 60%, use a 60/30/10 split for now and revisit it whenever rent, income or debt changes.
Most guidelines suggest 10-20% of after-tax income, including retirement contributions and extra debt payments. If that is not possible yet, start with any consistent amount and raise the percentage each time your income grows.
Use net (take-home) income. Budgets decide what happens to money you actually receive, and taxes are already gone before the split starts.
the budget spreadsheet that tracks all of this for you · a budget for a family of 4 with the categories most plans forget · how to budget money from zero · a savings tracker for the 20% you move first · a bi-weekly budget worksheet if you get paid fortnightly

How to use Google Sheets from zero: cells, formulas, formatting and sharing, explained with small real examples. No jargon, no prior Excel needed.
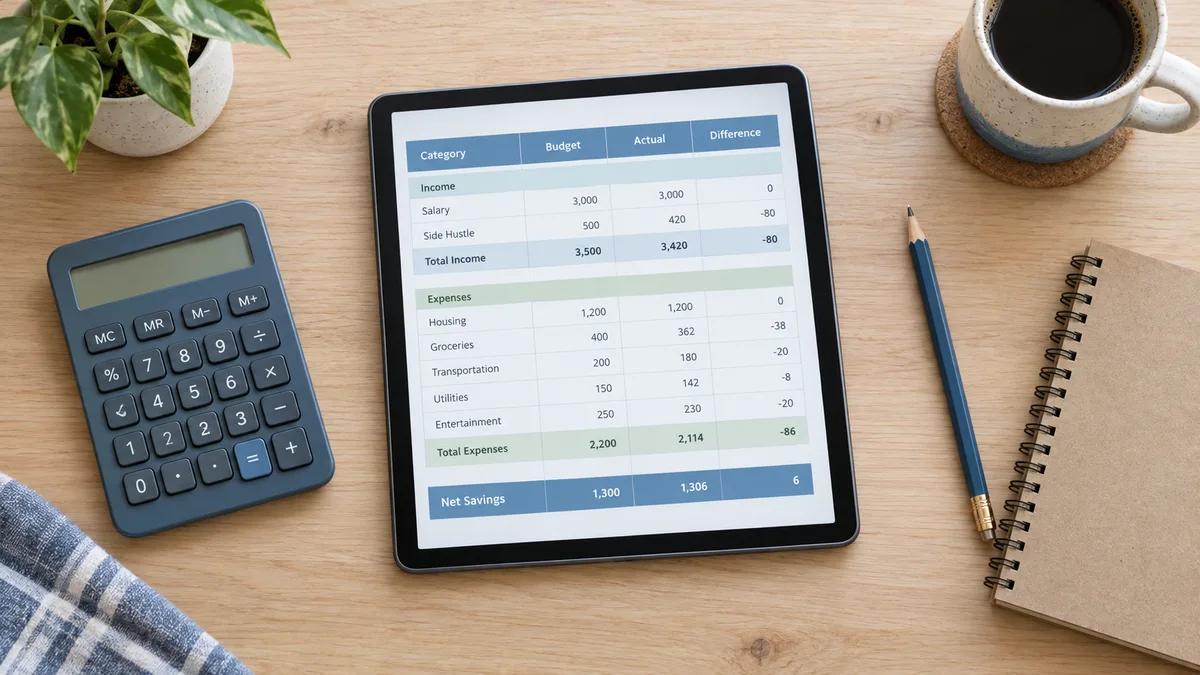
How to make a spreadsheet from a blank grid: plan the columns, add formulas, format it clean, and turn it into a reusable template. A 15-minute build.